When is it necessary to standardise the current indicators?
How common is a given disease? How high is the hospitalisation rate? What are the costs to the healthcare system? Many health and healthcare indicators are only meaningful in comparison if the size of the population to which they refer is known. For this reason, percentages or rates are calculated to present the numbers per 1000 or 100 000 inhabitants (crude rates).
It is often interesting to observe differences between regions or population groups, or how the rates have changed over time. In order to correct for the effect of different population compositions in comparisons, the structural characteristics of the population must be taken into account. First and foremost are age and sex structure. In a very elderly population, for example, one can expect that certain diseases will be more common and hospitalisation rates and the costs of the healthcare system will be higher compared with a younger population. It will also be observed that women of child-bearing age have more hospital stays than men of the same age.
Major differences in a population’s demographic characteristics can be seen in particular in a global context. But there are also differences between Switzerland’s cantons. For example, in 2022, the population of the canton of Ticino (24% aged 65 or over) was considerably older than that of the canton of Fribourg (17% aged 65+, cf. G1). Changes to the composition of a given region’s population can also take place over time.
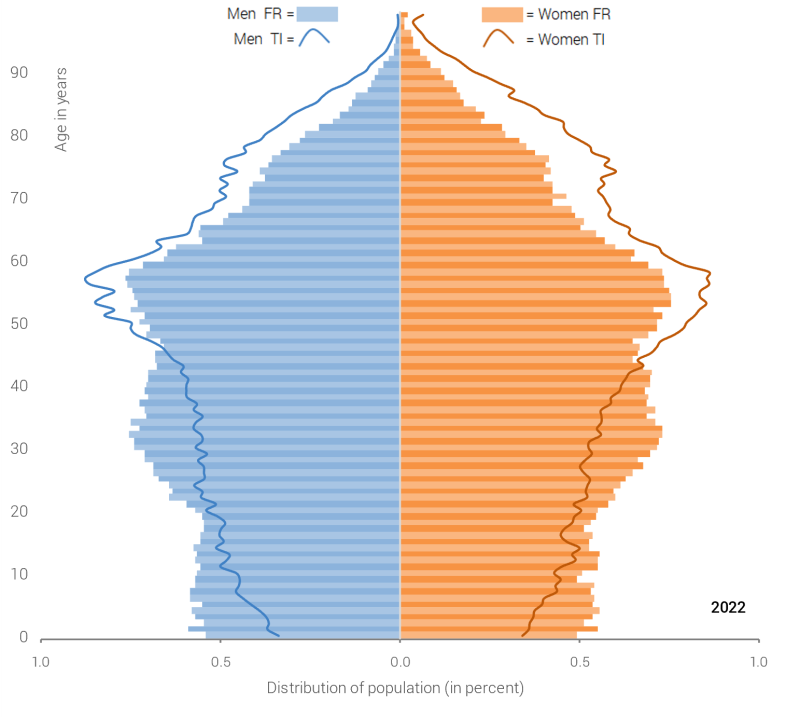
Graphic 1: Permanent resident population of the cantons of Fribourg (FR) and Ticino (TI) on 31.12.2022.
Source: FSO – STATPOP
If differences in composition are not taken into account, it can lead to distorted conclusions. These can be avoided through standardisation. Standardisation is a calculation enabling populations that are structurally different (e.g. in terms of location or time) to be compared. However, the standardised data no longer correspond to the actual number of cases or rates, which must be taken into account when interpreting the results.
Standardisation leads, for example, to a reduction in the mortality rate of the canton of Ticino in 2022 from 991 to 762 deaths per 100 000 inhabitants. In the canton of Fribourg, standardisation leads to an increase in the rate from 739 to 909 deaths per 100 000 inhabitants. The higher crude (non-standardised) rate in Ticino can be explained by the older population compared with Fribourg. If both population groups are based on the same demographic structure (here the European standard population in 2010), the comparison shows lower mortality in the canton of Ticino.
How does Obsan standardise indicators?
Standardisation is carried out using the direct method. This means that group-specific rates (by age and sex) are calculated and weighted to adjust them to the population composition of a theoretical standard population. This makes the results comparable between different population groups. With standardisation, simple, intuitive access to the effective numbers is lost at the same time.
Formula for the calculation of age and sex-standardised rates (R):
R : Age and sex-standardised rates
Nij : Number of persons in age group i and sex j in the standard population
rij : Age and sex-specific crude rates of the examined population
The European standard population in 2010 (Eurostat, 2013) is used as the standard population.
The confidence interval, which is also shown, is a measurement of the estimate’s accuracy. It defines the limits within which the true value can be found with a probability of 95%. For the indicators of the Swiss Health Survey (SHS), the confidence intervals are estimated using Taylor-series linearisation (Woodruff ,1971). For the other indicators, they are based on a gamma approximation of the variance in the rate (Tiwari et al., 2006).
Where can the crude rates and standardised rates be found?
A large proportion of the indicators published by Obsan are standardised. However, some are not standardised, e.g. because the sample is too small, the data by age and sex is incomplete, or because standardisation is not appropriate in all cases.
For the SHS indicators, crude (non-standardised) rates are provided by default. Move the slider on the graphic to display the age and sex-standardised rates. For indicators without a slider, only the standardised or crude rates are displayed. For the standardised indicators, however, the crude rates can always be found in the data tables, which can be opened by clicking on the corresponding button.
References
- Eurostat (2013). Revision of the European Standard Population – Report of Eurostat’s task force. Luxembourg: Publications Office of the European Union: Report.
- Tiwari, R.C., Clegg, L.X., & Zou, Z. (2006). Efficient interval estimation for age-adjusted cancer rates. Statistical methods in medical research, 15(6), 547-569: Publication.
- Woodruff, R.S. (1971). A Simple Method for Approximating the Variance of a Complicated Estimate. Journal of the American Statistical Association, 66:411–414: Publication.